
ChartGPT
Turn data descriptions into interactive charts instantly
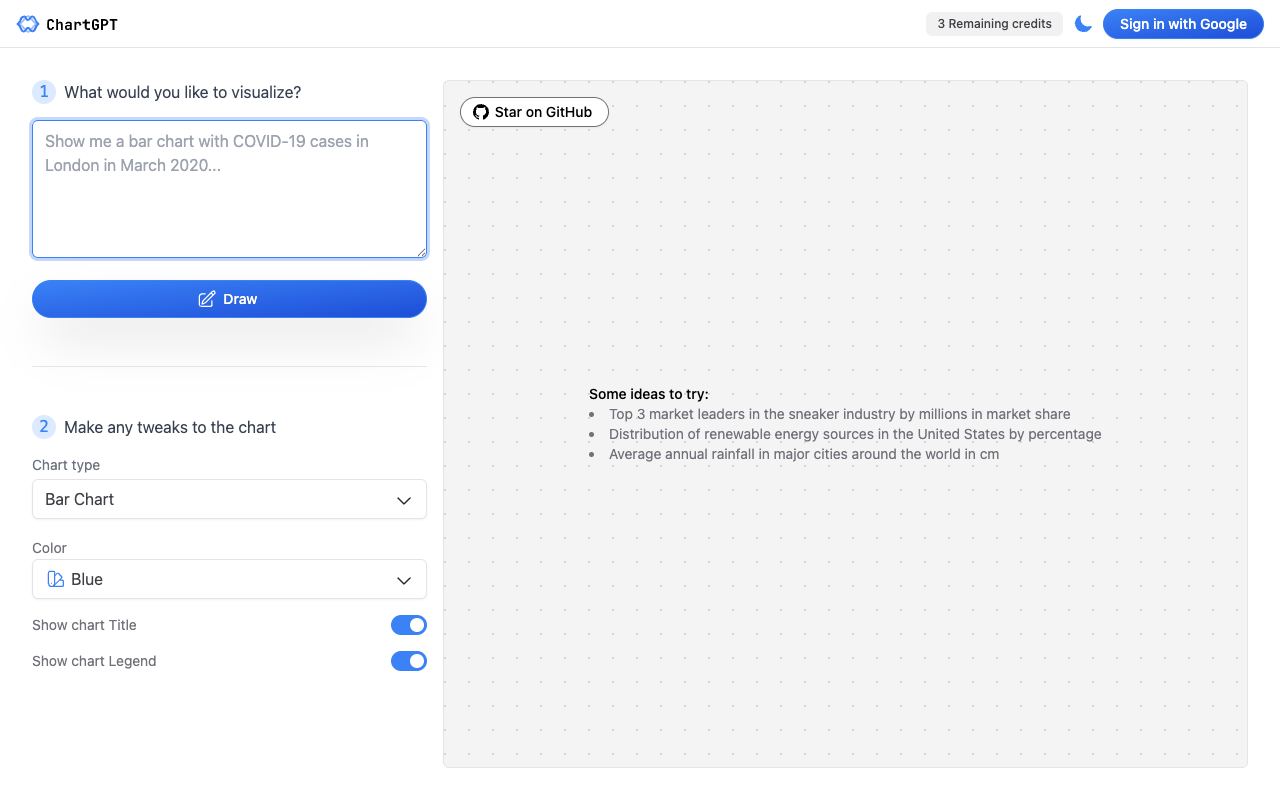
ChartGPT simplifies data visualization by letting you describe your chart in plain English. Instead of wrestling with charting libraries or spreadsheet tools, you can specify what data to visualize and how, and the AI handles the rest.
The tool works in two simple steps: describe your desired visualization, then refine the generated chart through available customization options. You can adjust chart types, colors, and toggle titles or legends to match your needs.
Highlights
- Natural language chart generation from plain text descriptions
- Customizable chart types, colors, and visual elements
- Support for diverse data visualization scenarios across industries
- Open-source architecture available on GitHub
- Instant visualization without requiring technical charting knowledge
Perfect for analysts, researchers, business users, and anyone who needs to visualize data quickly without learning specialized tools. ChartGPT is free and open-source.

Comments(0)
Sign in to comment